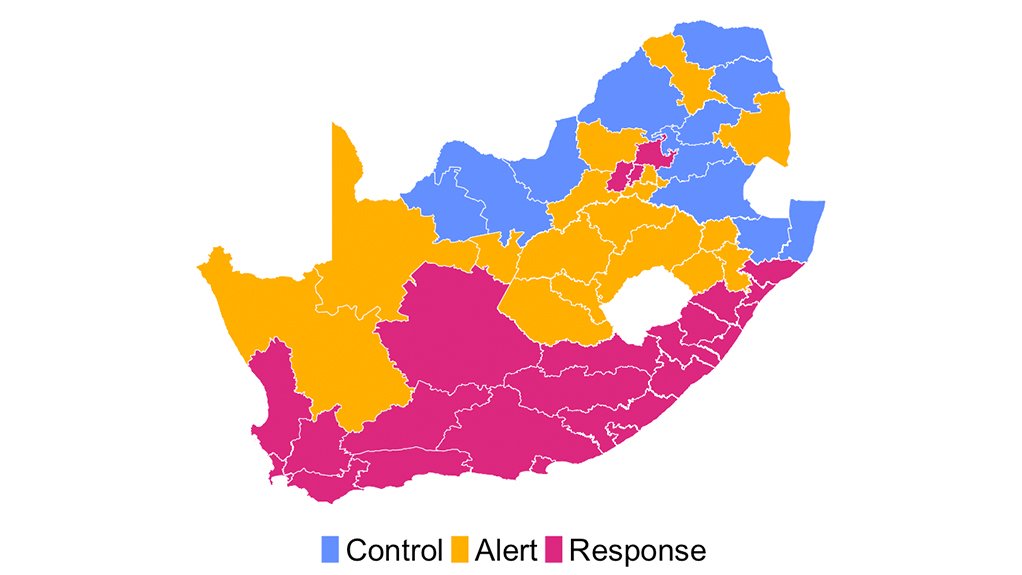
The South African Covid-19 Modelling Consortium (SACMC) has unveiled its new SACMC Epidemic Explorer dashboard to enable the public to assess the Covid-19 risk level in any district in South Africa.
The open-access dashboard, which will be updated regularly, presents various metrics that are used to support the South African government's planning efforts.
The dashboard analyses the resurgence risk, presents metrics to prepare for future outbreaks and monitors Covid-19 hospital admissions.
Users are able to access information about Covid-19 for the whole of South Africa, by province or by district.
The dashboard's resurgence analysis tab allows the public to view the Case Threshold Metric, which measures the Covid-19 risk lelvel in a province or district; and a Sustained Increase Monitoring metric, which provides an analysis of the epidemic curve to define a second wave and other stages of the epidemic.
With the Case Threshold Metric, an alert is triggered if new cases per week per 100 000 population are between 10 and 30 and triggers a response if new cases per week per 100 000 population exceed 30.
The metric indicates the size of the case load in an area and, because it is measured per 100 000 population, it can be used to compare the size of the epidemic between areas, states the SACMC.
This metric classifies an area as having one of three risk levels – control (low risk), alert (medium risk) or response (high risk).
The Sustained Increase Monitoring metric monitors sustained increases in case numbers, as well as current cases relative to cases at the time of the most recent peak.
It includes data about upswings in cases and whether provinces or districts have entered a second wave.
The SACMC confirmed during a briefing on December 15 that three provinces – the Eastern Cape, the Western Cape and KwaZulu-Natal – were now experiencing a second wave of infections.
Asked about whether the second wave in South Africa seems to be worse than the first, National Institute for Communicable Diseases (NICD) epidemiologist Dr Harry Moultrie said some areas of the country were experiencing a "substantial second wave", with hospitalisations as high or higher than during the first wave.
The dashboard also provides information on daily Covid-19 admissions and current Covid-19 hospital occupancy.
In future, the SACMC plans to also make data available to the public about vaccine modelling, but says it will be some time before it is able to provide that information to the public.
The SACMC was established in March and is a collaboration between the NICD, the University of Cape Town Modelling and Simulation Hub Africa, Stellenbosch University South African Centre for Epidemiological Modelling and Analysis and University of the Witwatersrand Health Economics and Epidemiology Research Office.
EMAIL THIS ARTICLE SAVE THIS ARTICLE ARTICLE ENQUIRY
To subscribe email subscriptions@creamermedia.co.za or click here
To advertise email advertising@creamermedia.co.za or click here


